Have you tried drawing your first pyplot? If not then please see my previous post about this.
Let's move ahead and learn about the matplotlib scatter plot
Before plotting a plot we need data to plot. So here we are taking an example of cars data in csv format which you can download here cars data
If you face any issue while downloading the file, comment me your email so that I can share the same directly.
Since the cars data is in csv format we need to first read the data with the help of pandas library as below-


The data will be looked look as below-

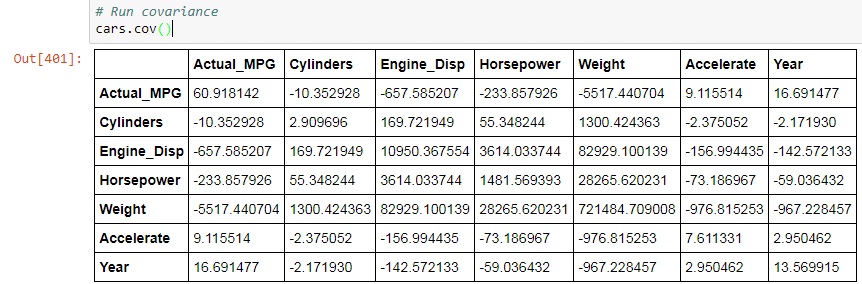
Since data is too long we need solid information from the data to plot so run Correlation & then run Covariance to find the most correlated variable to MPG-


Final cleaning of the cars data-

See now we have info to plot then let's plot it as given below-

Looks very cool right. Let's plot another one -

Key Note-Boxplots are great when you have a numeric column that you want to compare across different categories. When you want to visualize two numeric columns, scatter plots are ideal.
Please try above plotting in your notebook and comment if you face any issue.
Let's move ahead and learn about the matplotlib scatter plot
Before plotting a plot we need data to plot. So here we are taking an example of cars data in csv format which you can download here cars data
If you face any issue while downloading the file, comment me your email so that I can share the same directly.
Since the cars data is in csv format we need to first read the data with the help of pandas library as below-
The data will be looked look as below-

Since data is too long we need solid information from the data to plot so run Correlation & then run Covariance to find the most correlated variable to MPG-

Final cleaning of the cars data-

See now we have info to plot then let's plot it as given below-

Looks very cool right. Let's plot another one -

Key Note-Boxplots are great when you have a numeric column that you want to compare across different categories. When you want to visualize two numeric columns, scatter plots are ideal.
Please try above plotting in your notebook and comment if you face any issue.
Comments
Post a Comment