
Another post starts with you beautiful people!
We have learnt basic required algorithms in our previous posts. Now the time has come to apply all our learning in a real world machine learning problem.
In the next coming posts you will see step by step how to work on a machine learning project and you will wonder all the previous posts you have read till now, have all the tools to achieve our goal.
For all the new members who wants to get the dataset of a real world problem, just get those datasets from our beloved site-Kaggle.
In this post we will work on a prediction challenged Titanic Machine Learning organized in Kaggle and learn how to submit our model there.
Competition Description:
The sinking of the RMS Titanic is one of the most infamous shipwrecks in history
One of the reasons that the shipwreck led to such loss of life was that there were not enough lifeboats for the passengers and crew. Although there was some element of luck involved in surviving the sinking, some groups of people were more likely to survive than others, such as women, children, and the upper-class.
Goal:In this challenge, we are asked to complete the analysis of what sorts of people were likely to survive. In particular, we are asked ask to apply the tools of machine learning to predict which passengers survived the tragedy.
Dataset: The data has been split into two groups-
- The training set (train.csv) should be used to build our machine learning models.
- The test set (test.csv) should be used to see how well our model performs on unseen data.
Step 1: Data Preparation


Peek at the first five rows of the data: input_dataset.head()
Know the shape of the data: input_dataset.shape
Let's find out which gender survive more:

Output :
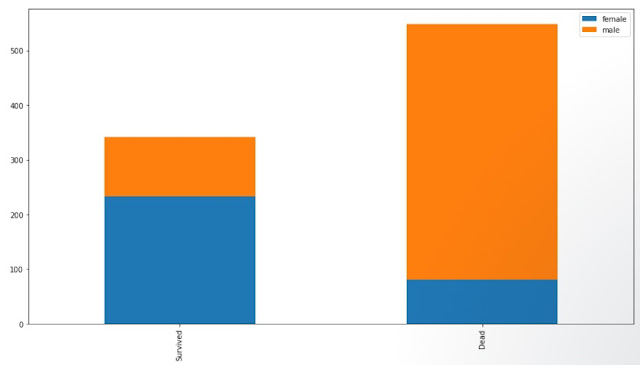
Let's find out which gender survive more:
Output :

Let's find out relation between Fare with the survival:
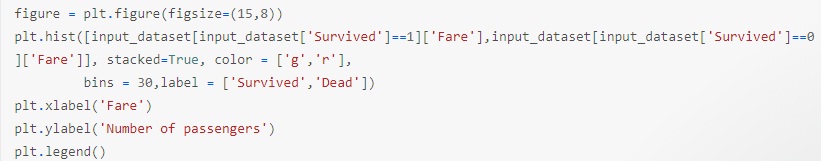 Output:


The same way you need to see the co-relationship between other variables of the dataset and find out how they affect the survival.
Step 2:Training sets generation

In the same way you need to process each column of the dataset and deal with the missing data, repeating data and do feature engineering to get the information.
Step 3:Algorithm training,evaluation and selection
Step 2:Training sets generation

combined = get_combined_data()
# Replace missing values with "U0" in Cabin column
combined['Cabin'][combined.Cabin.isnull()] = 'U0'
#processing the Age column
#Age variable is missing 177 values so we cannot simply remove it
grouped_train = combined.head(891).groupby(['Sex','Pclass','Title'])
grouped_median_train = grouped_train.median()

grouped_test = combined.iloc[891:].groupby(['Sex','Pclass','Title'])
grouped_median_test = grouped_test.median()
In the same way you need to process each column of the dataset and deal with the missing data, repeating data and do feature engineering to get the information.
Step 3:Algorithm training,evaluation and selection
def compute_score(clf, X, y, scoring='accuracy'):
    xval = cross_val_score(clf, X, y, cv = 5, scoring=scoring)
    return np.mean(xval)
def recover_train_test_target():
    global combined
    train0 = pd.read_csv('../input/train.csv')
    targets = train0.Survived
    train = combined.head(891)
    test = combined.iloc[891:]
    return train, test, targets
train, test, targets = recover_train_test_target()
from sklearn.ensemble import RandomForestClassifier
from sklearn.feature_selection import SelectFromModel
clf = RandomForestClassifier(n_estimators=50, max_features='sqrt')
clf = clf.fit(train,targets)
print(clf.feature_importances_)
features = pd.DataFrame()
features['feature'] = train.columns
features['importance'] = clf.feature_importances_
features.sort_values(by=['importance'], ascending=True, inplace=True)
features.set_index('feature', inplace=True)
features.plot(kind='barh', figsize=(20, 20))
#transform our train set and test set in a more compact datasets
model = SelectFromModel(clf, prefit=True)
train_reduced = model.transform(train)
train_reduced.shape
test_reduced = model.transform(test)
test_reduced.shape
Check the accuracy of the model:
from sklearn.model_selection import cross_val_score
compute_score(model, train, targets, scoring='accuracy')
Save the output and submit in Kaggle:

The above code will generate the output as a csv file in the required format as described by Kaggle.
From the above steps I have got accuracy of 83% in my prediction and when I submit the same in Kaggle I got the score as 0.79-

If you want to explore the actual code you can get it from here- Get the actual code and share your inputs also.
Whenever you are going to tackle a machine learning problem in Kaggle, always follow below steps-
- Data exploration and visualization
- Data cleaning
- Feature engineering
- Feature selection
- Hyperparameters tuning
- Submission
I request you to all download the notebook from the above url, explore more features in the dataset, find more co-relations wrt survival and apply different algorithms.
This will enhance your knowledge and surely improve your model accuracy as well as rank in competitions.
Meanwhile Friends! Go chase your dreams, have an awesome day, make every second count and see you later in my next post.
Comments
Post a Comment